Desktop App
The software running this website also has a desktop application for Windows (and in theory Linux) which provides a few extra features over the website:
- Custom charts - any variables, any time span, any aggregates, multiple separate timespans in one charts
- Data export (CSV or tab-delimited)
- Viewing data in a grid
- Browsing images
- Viewing weather data at the time of a photo or time-lapse video
- Rainfall summary visualisation
- Reporting engine supplied with a number of common reports
The application supports running over the Internet as well as connecting directly to the weather database. This page gives a quick overview of the application and how to set it up to connect to one of the weather.zx.net.nz weather stations over the Internet.
The current version is 09-JUL-2020. Download it here
Contents:
Note that this application is still in development and still has a few bugs hidden around the place.
For video playback support you may need to install a video codec. LAVFilters should work. The latest release is available from https://github.com/Nevcairiel/LAVFilters/releases
Recent changes
- 9 July 2020
- New Features
- Live data is now stored in memory for up to an hour. This data is saved on exit and on startup any data less than an hour old is re-loaded. This enables:
- A new live plot to be populated immediately with data stretching for up to an hour into the past
- Changing settings in the live plot window no longer clears all data in the plot
- When incresaing the timespan covered by a live plot additional data will be loaded in.
- Support for additional sensors on wireless Davis Vantage Pro2 weather stations. This includes the full set of extra temperature and humidity sensors plus the soil moisture/leaf wetness station sensors. Only configured sensors are shown in the UI and they are shown with their configured names. This has resulted in the following changes:
- In Charts: the "Select graphs" section of the New Chart/Add Data Set/Add Graph dialogs has been recategorised and sorted into tabs: Common, Highs and Lows, Leaf & Soil, Extra Sensors. The following sensors now move into the new "Highs and Lows" tab: High Outside Temperature, Low Outside Temperature, Gust Speed, Gust Direction, High Solar Radiation, High UV Index.
- In Live Charts: similar changes to Charts. The Choose graphs/Add graph dialogs have been had Leaf & Soil and Extra Sensors tabs added
- In Export: Same tab arrangement as for Charts. New buttons have been added to check or uncheck all columns
- The following new reports have been added
- Leaf Wet Hours: Vantage Pro2 only, requires Leaf & Soil station with at least one leaf wetness sensor.
- Soil Temperature Hours
- The view data window now includes the same column picker as the new export window allowing you to choose what columns to display
- Support for changing display units!
- Units can be changed between Metric and Imperial. This affects charts, view data, the main window and optionally exports.
- Wind speed can now be shown in km/h instead of m/s through-out the application when using Metric units.
- Units are now included in column headings for the view data window and export files
- New report: Sunshine hours. This report has a choice of two algorithms for calculating approximate sunshine hours and provides links to plot a chart or view images for that date.
- UV Exposure category is now shown in the main window
- Chart fonts can now be customised via context menus on the title, legend and axes. Defaults can be changed in the settings dialog
- Command line arguments!
- Override configured station code via command line parameters. This disable data source settings in the settings window while allowing a second instance to run with the same config file: zxweather.exe -s sb
- All internal URLs for opening charts, datasets and images that are valid in reports can now be supplied as a command line parameter to open when the application starts. This means you can now, for example, open the view images window on a particular date by running: zxweather.exe zxw://view-images?date=2019-08-17
- Configuration file can now be specified on the command line: zxweather.exe -c foo.ini
- The report search path can now be altered on the command line. If an instance of the application is already running these changes will be forwarded to that instance. This example will add "C:\my_reports" to the search path and remove all built-in reports: zxweather.exe --report-path-add "C:\my_reports" --report-path-remove ":/reports"
- Log output can now be directed to a file: zxweather.exe --log-file zxw.log
- Run the configuration wizard again: zxweather.exe --show-config-wizard
- Live data is now stored in memory for up to an hour. This data is saved on exit and on startup any data less than an hour old is re-loaded. This enables:
- Other Enhancements
- Reporting System
- Support for Lambdas in reporting system mustache templates
- Support for Partials in reporting system mustache templates
- Support for transforming datasets in JavaScript
- Support for displaying datasets generated by JavaScript in a report output grid
- Support for linking to the view images window at a particular date from reports
- Support for sensor picker widgets in criteria pages
- Evapotranspiration is now plotted with the same line style as rainfall by default
- Charts can now be saved as SVG
- Only a single instance can be run against a particular station code. This protects a number cache files from corruption. When launching a second time the existing instance will be given focus and passed certain command-line arguments that were supplied to the second instance. The settings dialong and configuration wizard won't allow you to change to another station that is already open in another instance of zxweather.
- Upgraded charting library to latest release
- Reduce CPU usage of live data monitor
- The user will now be notified about any failure to connect to the live or sample data source
- Settings dialog only reconnects the data source when data source changes are made
- Reporting System
- Misc Changes
- Changed the executable name from desktop.exe to zxweather.exe
- Changed the configuration filename from zxweather-desktop.ini to zxweather.ini. Note that if you rename the executable the default name for the config file will also change (foo.exe, foo.ini)
- Fixed bugs
- HTTP Redirects are now handled properly when using the web data source
- Now builds properly with Qt 4.8 and 5.5 again
- Fix cancel button in the live plot options dialog applying changes instead of canceling
- Fix images and weather data not loading with Qt 5.5 or earlier when HTTP redirects are involved
- Fix toolbars with missing titles
- Fix sorting of weather data in the database data source
- Fix live data feed sharing between multiple windows when using the database data source
- Fix averaged updates in live plots. This feature was totally broken and just produced effectively flat line graphs
- Reports, charts, view data and export are now correctly disabled when the database or web server can't be contacted. They now also correctly re-enabled when contact is re-established.
- Fixed opening images window at current date not working reliably
- Fixed some minor layout issues with the sunrise/sunset and averages report criteria pages
- Sunrise/Sunset report: round decimal latitude/longitude values to a more sensible number of decimal places
- Fix rare crash using the Weather Server live data source
- Fix multimedia support being disabled when building with Qt 4.8
- Fix build issue with Qt 5.13
- If the config wizard is canceled the application now simply exits.
- Fix rainfall visualisation not resetting overnight when using the database live data source
- Prevent the main window toolbar from being hidden or undocked as there is no way to undo these actions at the moment
- Fix degree symbols in Qt 4.8
- Fix images can not be dragged to MS-Paint (paint compains it can't find some garbage filename)
- Fix rainfall visualisation can not be dragged ot MS-Paint (paint compains it can't find some garbage filename)
- Fix missing degree symbol on wind direction in the main window
- Database connection option is now disabled in the configuration wizard and settings window if the PostgreSQL database driver is not installed correctly
- Fix inconsistent use of colons in field labels
- Fix unable to delete graph from chart by clicking on legend item and hitting delete
- Fix clicking on a graph in the plot doesn't highlight the associated legend item
- Fix turning on aggregation in live plots doesn't clear the plot
- Remove start and end date fields on sunrise/sunset reports criteria page - they were redundant and didn't do anything
- Ensure all report resources are loaded as UTF-8 to ensure special symbols display correctly
- Fix Average High and Average Low columns being switched in the Monthly Averages report
- Remove all case-sensitive station code comparisons from report queries
- Fix hang on "Chacking Cache Status..." when running reports for date ranges that are fully covered by the sample cache
- Fix interval types not being sorted correctly in report grids
- Fix crash when cleaning up report custom criteria page
- Fix occasional script engine crash when built with Qt 5.7 and newer
- Fix station records report results window too big
- Fix rainfall report results window too big
- Fix Sunrise & Sunset report results window too big
- Fix a number of style inconsistences in storm rain results window (heading, table style, start/end time formatting, window too big)
- New Features
Installation / setup
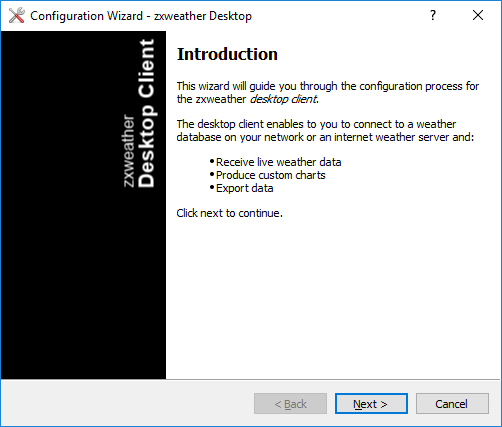
To set it up, extract the zip file somewhere and run desktop.exe. The first time you start the application you'll get the first run wizard which starts off with an intro page:
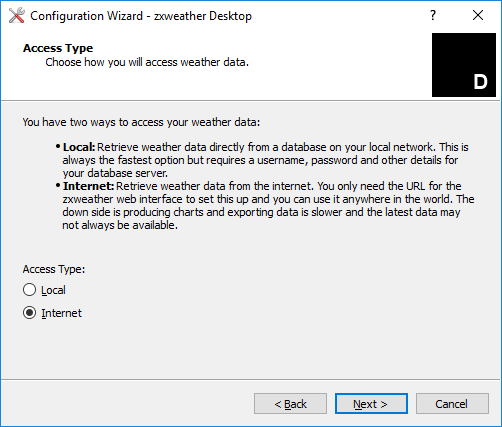
Hit next and it will ask you how you want to get data. Choose the Internet option and hit next:
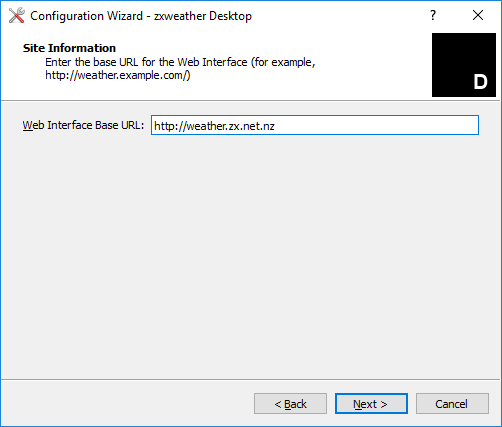
Now you'll need to enter the URL for the website to fetch data from. Enter http://weather.zx.net.nz and hit next
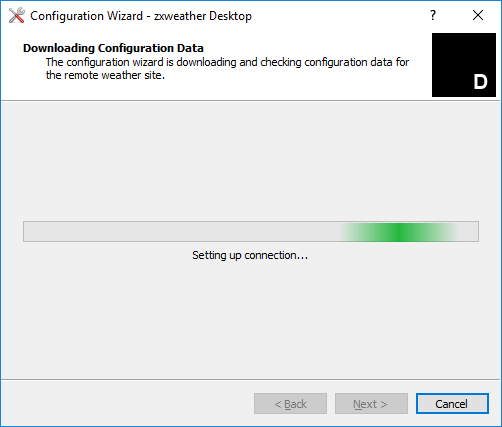
The application will go off to the Internet to figure out what weather stations are available and how to access them:
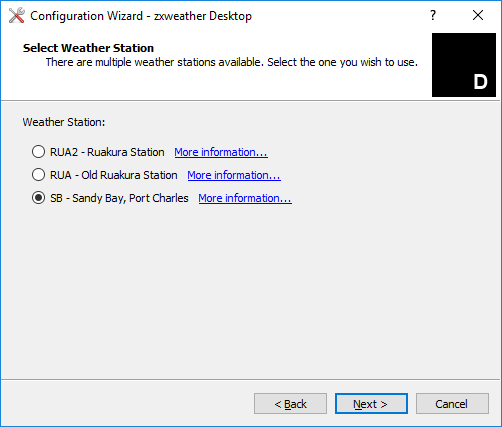
Then you'll be allowed to pick a weather station. RUA2 is in Hamilton and SB is at Sandy Bay on the Coromandel Peninsula. Ignore the RUA weather station - it still works (sometimes) but its old, inaccurate, unreliable and only exists for testing purposes now:
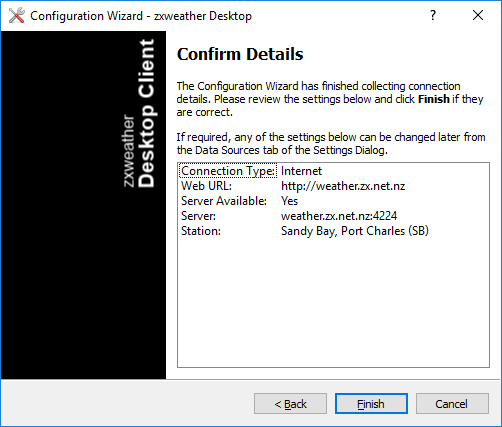
Lastly you'll be given an overview of the settings you chose. Hit finish to complete the setup:
The settings you chose will all be saved in a file called zxweather-desktop.ini in the same folder as desktop.exe. If you want to run this configuration wizard again, open zxweather-desktop.ini and delete its contents.
Uninstallation
Uninstallation is quite easy - just delete the files you unzipped and also delete the cache directory. It doesn't leave files anywhere else on your system or place anything in the registry.
- Delete the files you extracted from the zip file (desktop.exe, etc)
- Delete the cache directory: Paste %LOCALAPPDATA%\zxnet\ into the address bar of windows explorer and hit enter. Explorer will navigate to somewhere like "Your Name > AppData > Local > zxnet". In this folder you'll see a folder called "zxweather-desktop". You can safely delete this folder.
UI Overview
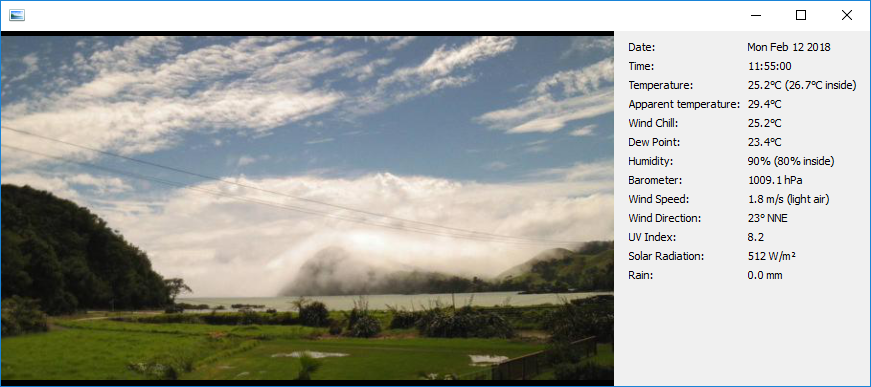
The main window looks like this:
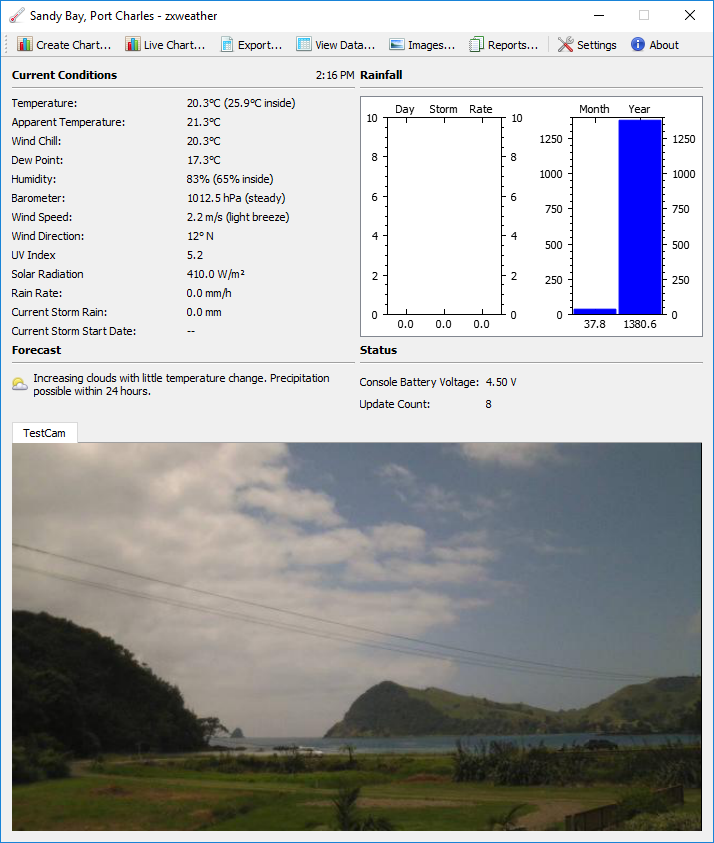
Here it shows the current conditions, some status information, the latest photo and a rainfall summary. The rainfall summary graph and the current photo support drag & drop. This means you can, for example, drag the rainfall summary into your email client to attach it to an email or drag a photo into windows explorer to save a copy. You can also double-click on the photo to open it in a new window where you can make it bigger.
Charts
Click on the 'Create Chart...' toolbar button to make a chart. This will pop open the New Chart dialog:
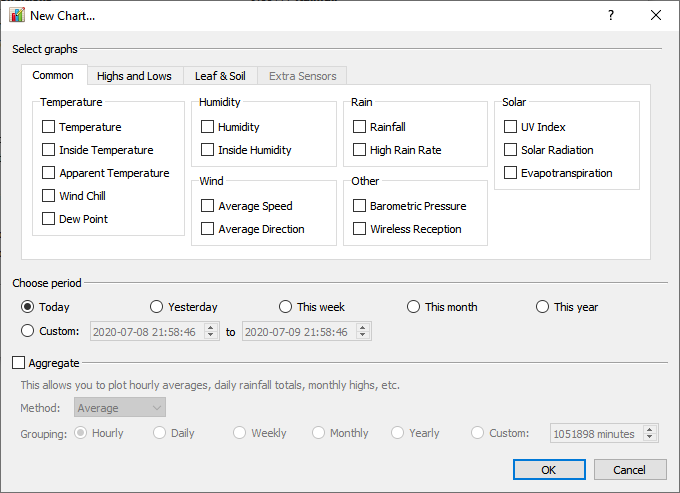
From here you can choose what variables you want in the chart, what timespan you want to cover and if you want to aggregate data. With aggregates you can, for example, plot an hourly average or a daily high instead of just the 5 minute data points. For rainfall you can also use Sum (total rain over the grouping period) or a Running Total.
Once you hit OK the application will go off to the server to download the data for the chart which may take a little while depending on the range you chose. Once its finished downloading you'll get a chart:
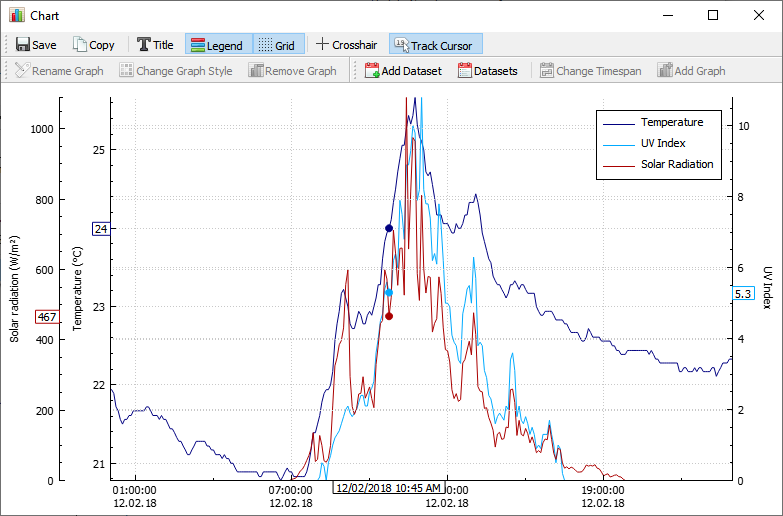
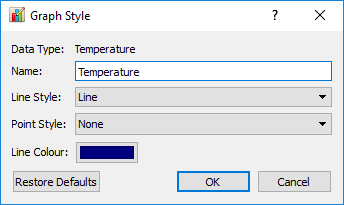
You can double click on an axis label to rename it or you can double click on a graph (either the line itself or the entry in the legend if its visible) to change details about that graph:
You can also right-click on the chart to bring up a context menu:
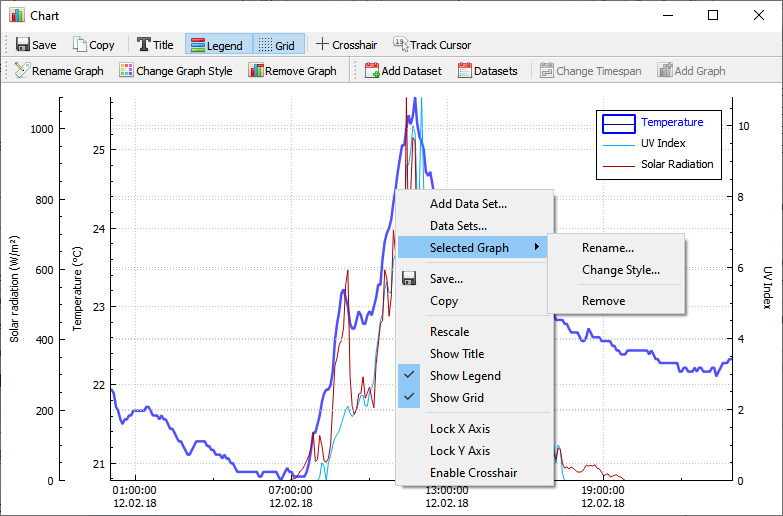
If you've got a graph in the chart currently selected you'll have extra options including an option to remove it from the chart.
To add an extra graph to the chart right-click on the X axis and choose "Add Graph...". You'll get a dialog where you can choose which extra graphs to add:
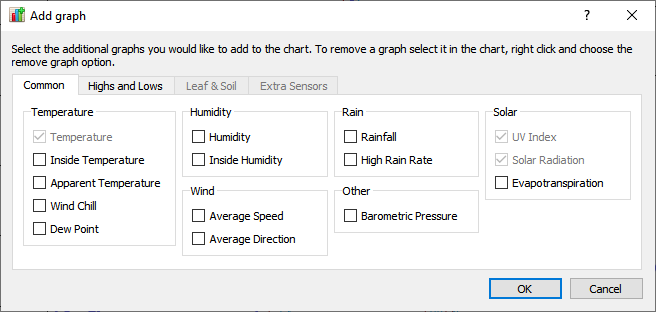
Because the data has already been downloaded for the timespan covered by your chosen X axis adding the graph is quick - it only requires a replot of the chart.
You can also add an extra data set to the chart. Each data set has its own X axis with its own timespan and aggregate settings. This allows you to plot, for example, todays temperature vs yesterdays temperature. To add a data set right-click on the chart and choose "Add Data Set...". This will bring up the add data set dialog (which looks the same as the new chart dialog). Once you've chosen your options the application may download extra data from the server.
With multiple data sets in a chart, when you right-click on the chart there will be an extra 'Rescale' menu option. Here you can try to align the X axis by Time (nothing will line up unless its the exact same time), Time of Year (days and months will be lined up) or Time of Day (Hours and Minutes will be lined up)
To remove a data set and all the graphs associated with it, right-click on the data sets X axis and choose remove.
You can also click and drag axes to move the associated graphs around. Or you can select an axis and use your scroll wheel to zoom that axis and its associated graphs in and out. If you have the lock axis options selected dragging or zooming one X or Y axis will drag or zoom the all other X or Y axis at the same time allowing you to zoom or reposition the entire graph.
To save the graph, right click and choose Save.
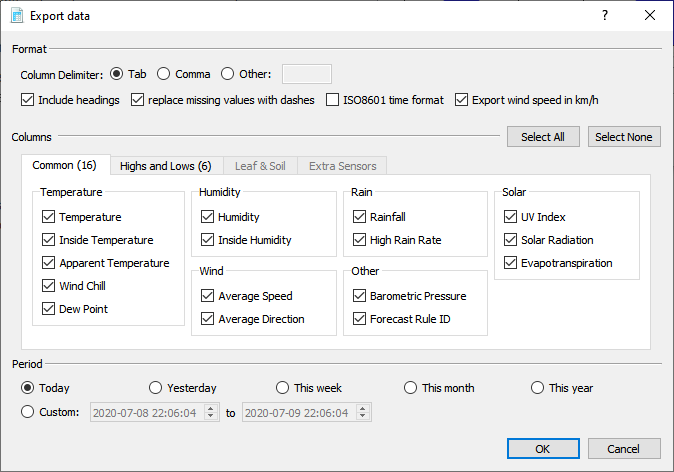
Data Export
To export data to a delimited text file readable by Microsoft Excel and other spreadsheet programs, choose the "Export..." button on the main window. This will display the export dialog where you can choose the delimiter (use Comma to make a CSV file), the columns you want to export and the timespan to export. When you hit OK it will download the requested data from the server then prompt you to save it somewhere.
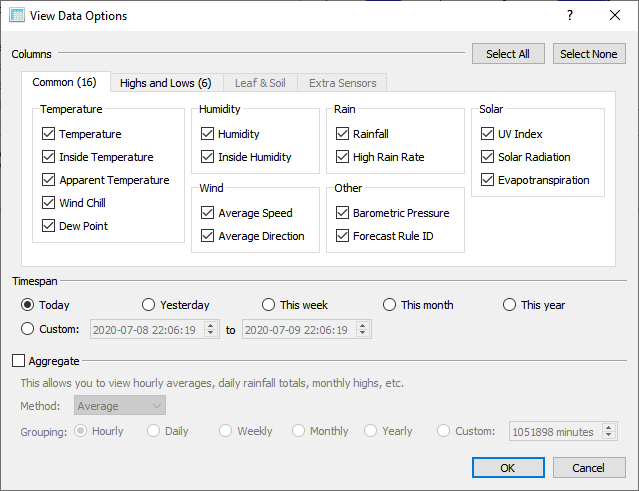
View Data
The view data button on the main window allows you to view data in a grid. Here you can choose a timespan and optionally an aggregate. This allows you to look at, for example, daily highs for the past month.
View Images
Click on the Images button on the main window to view images by day:
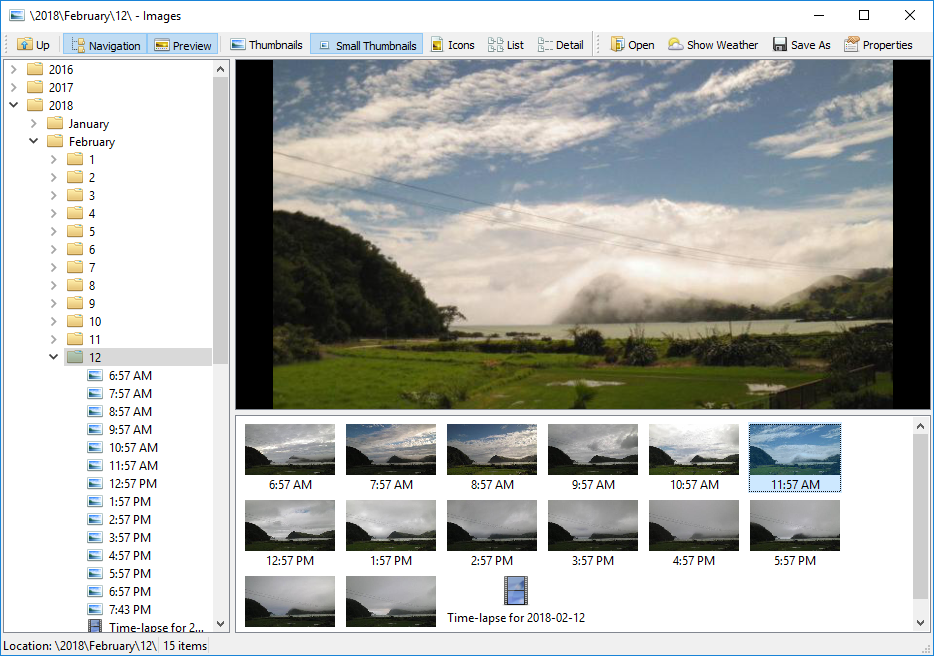
When you select a day the application will download all images for that day from the server. These images are cached on your PC so the download will only happen once. You can resize the panels in this window or double click on images to open them in a new window where you can resize them.
You can also right-click on images to bring up a context menu:
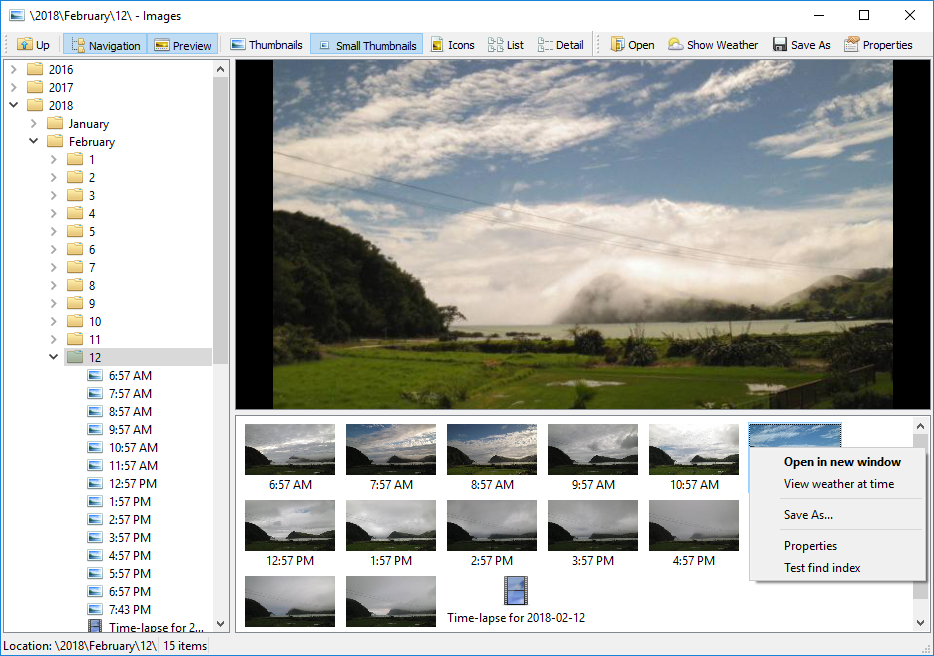
The "View weather at time" option will display the weather conditions for the five minute period covering the time the photo was taken:
For time-lapse videos the displayed weather conditions will change as the video plays
Reports
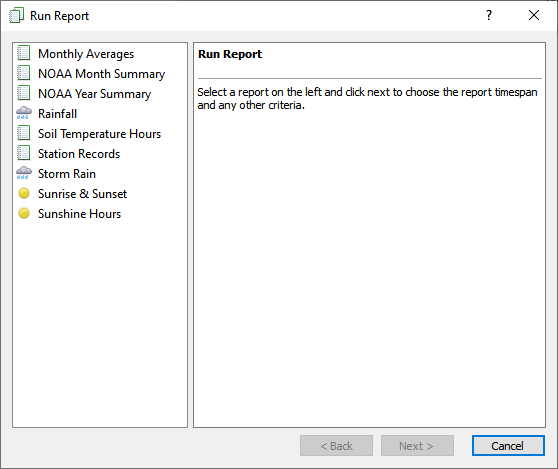
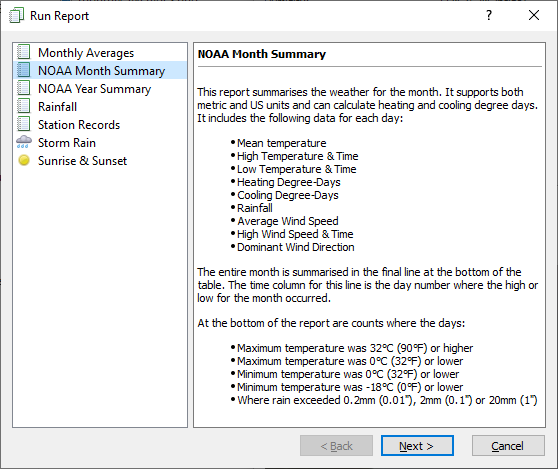
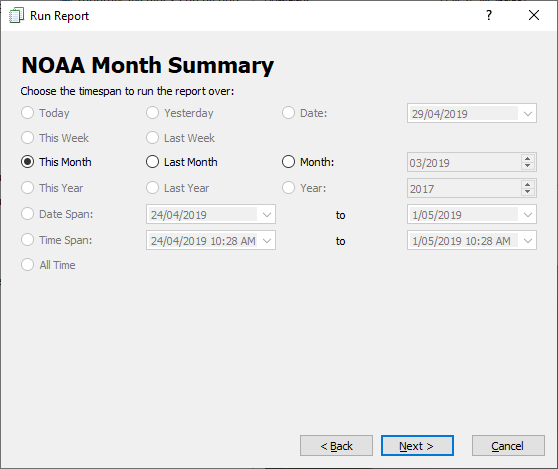
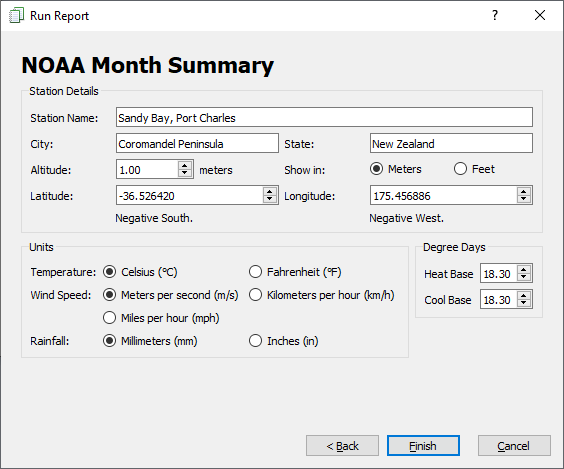
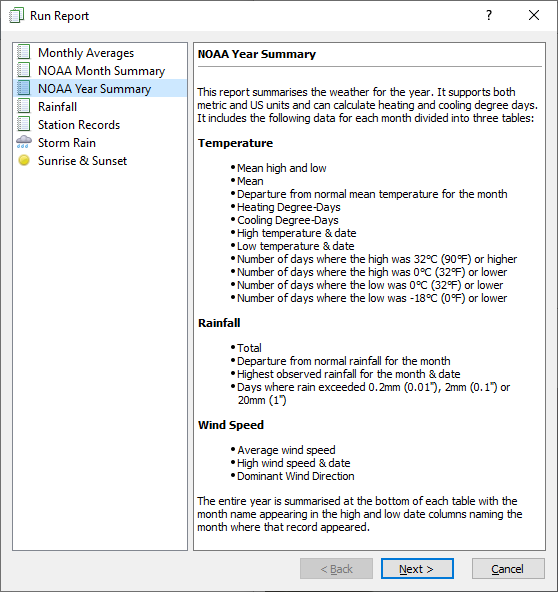
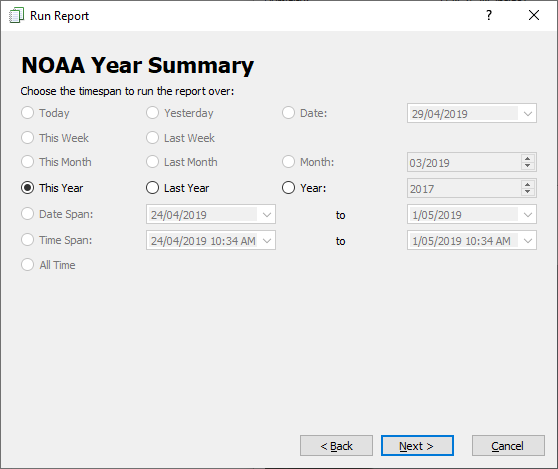
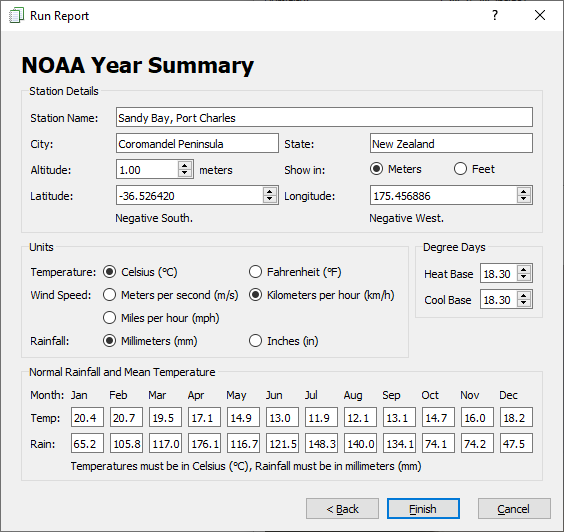
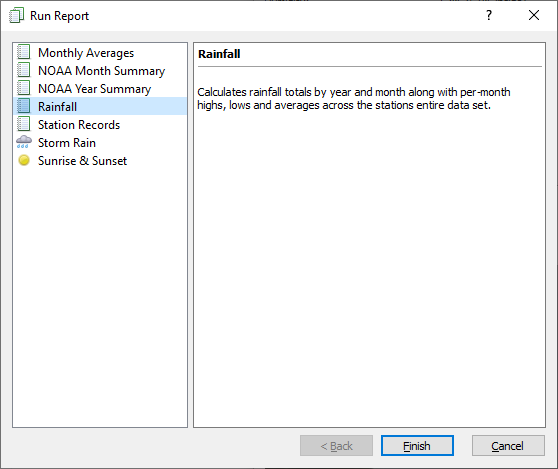
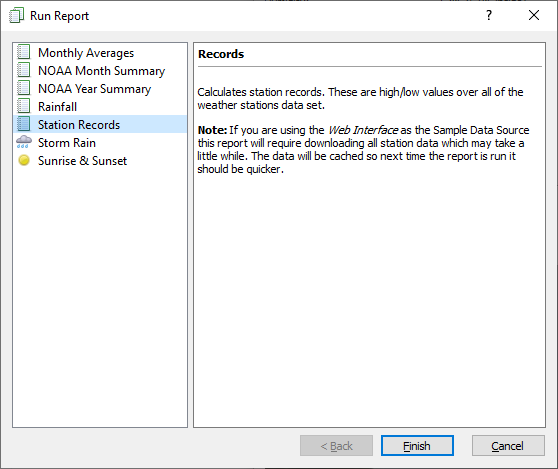
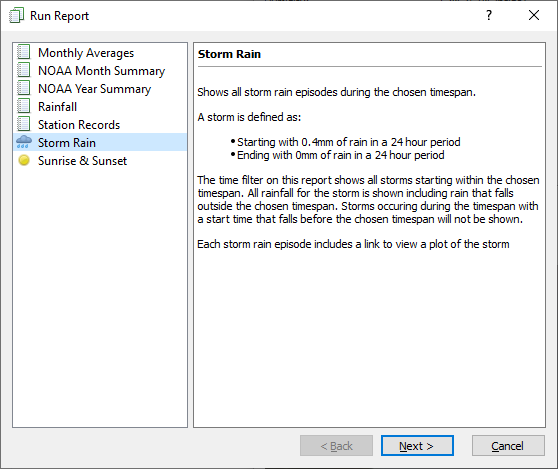
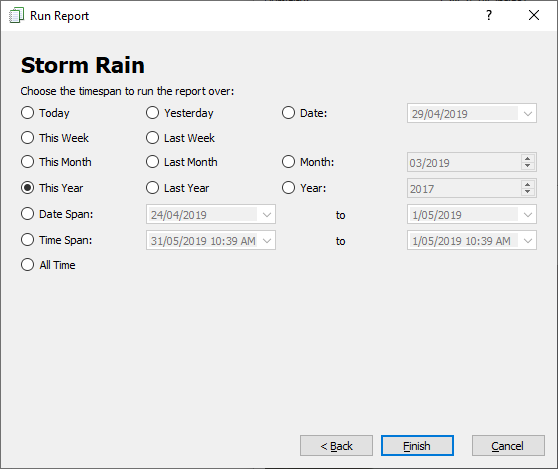
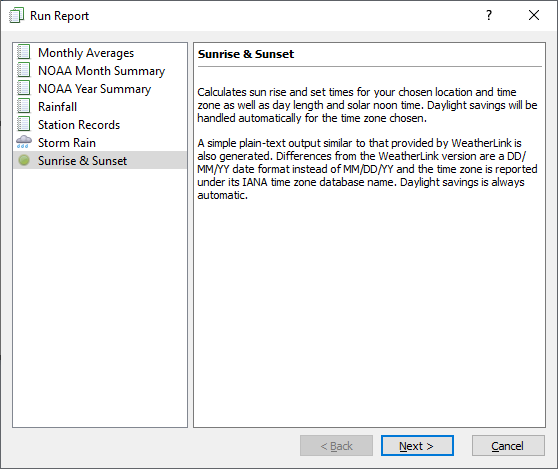
To run reports, click the "Reports..." on the main window. This will display the run report wizards first page where you can choose from any available built-in or custom reports. Selecting a report displays its description in the panel to the right, double clicking the report moves to the next step. Some reports may run instantly (indicated by a "Finish" button) while others may require further details such as a timespan.
Built-in reports
The built-in reports at this stage are:
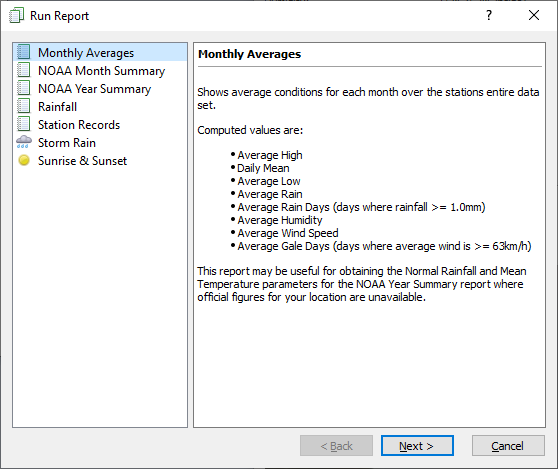
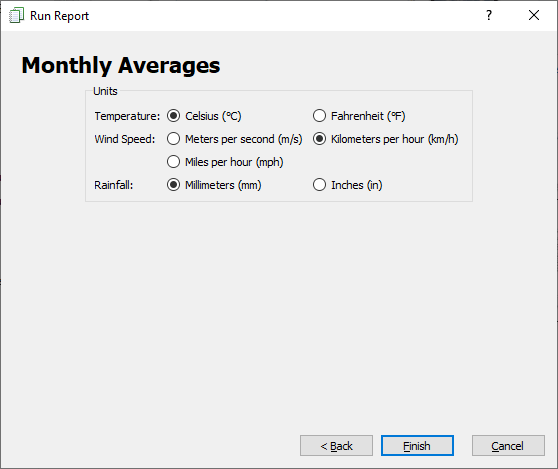
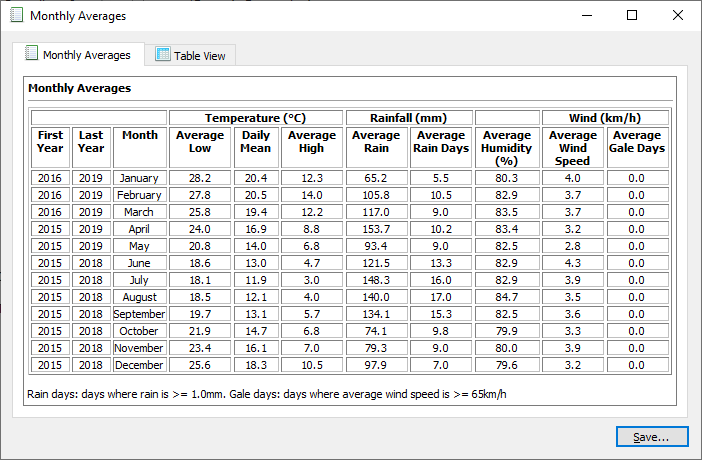
The sections below contain screenshots of these reports.Monthly Averages
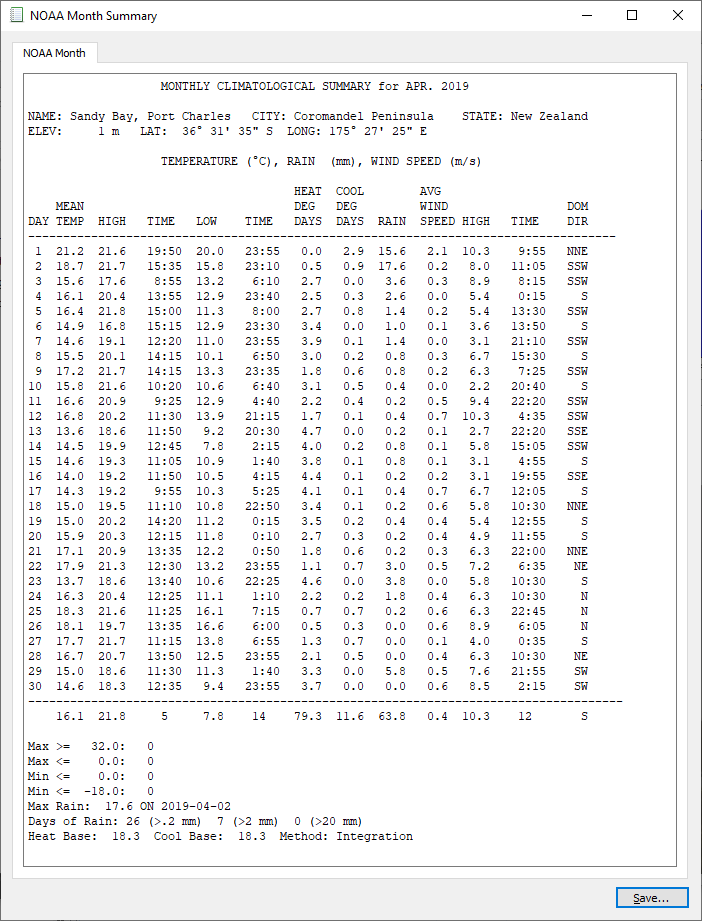
NOAA Month
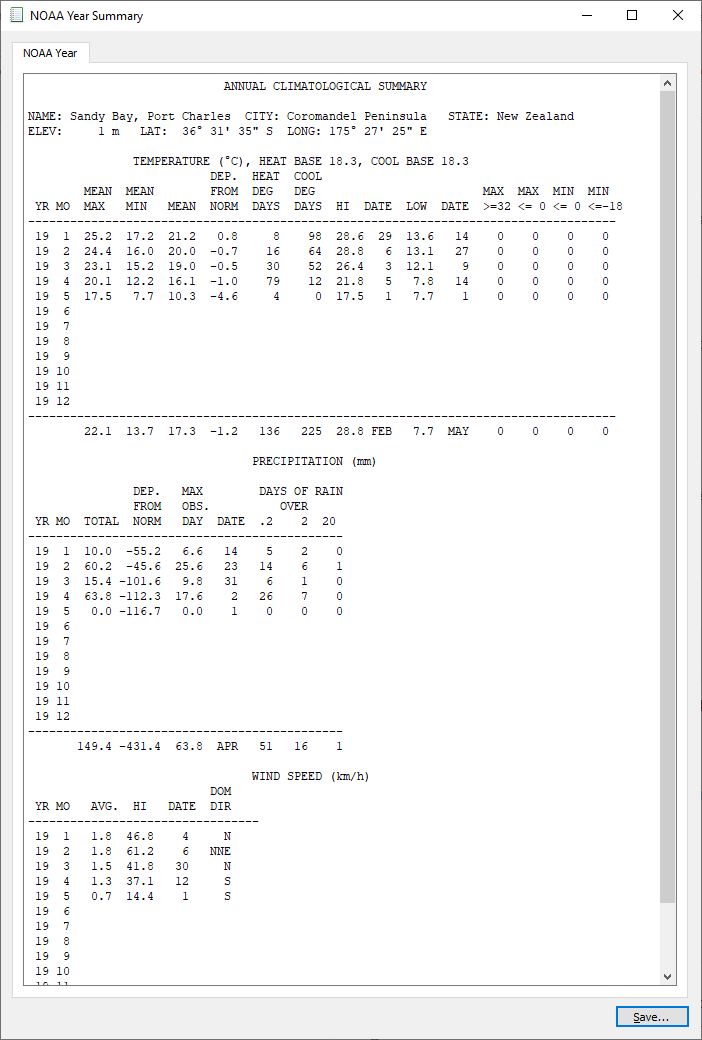
NOAA Year
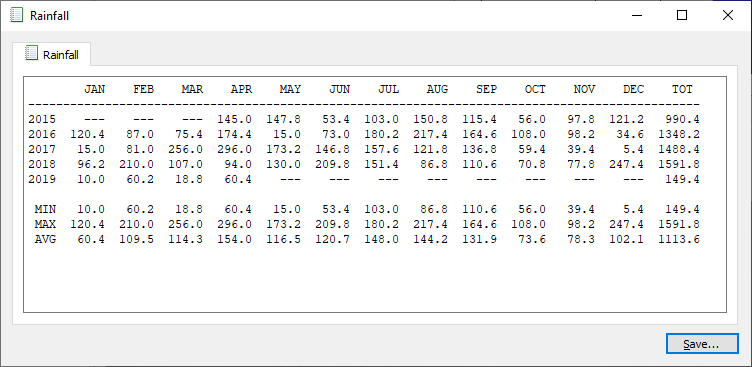
Rainfall
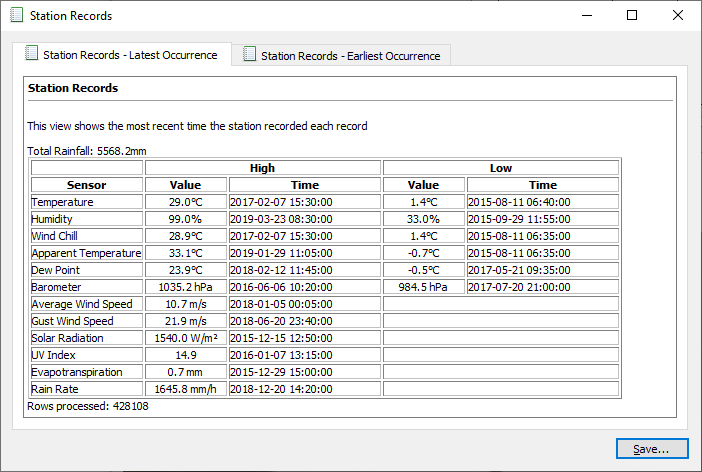
Station Records
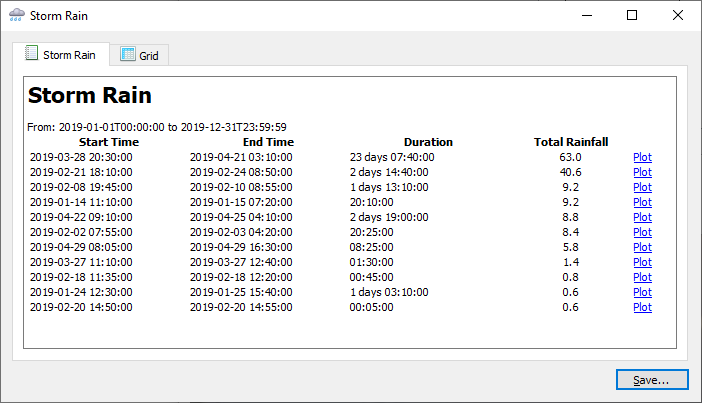
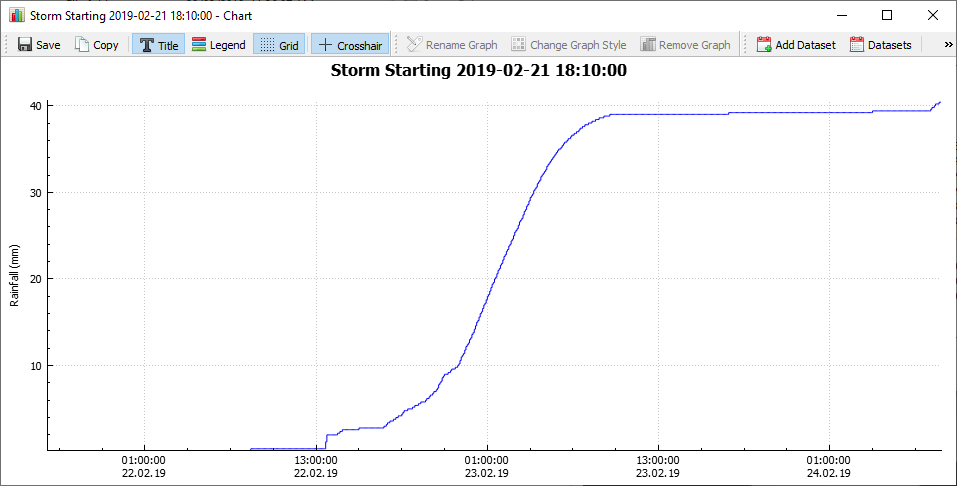
Storm Rain
This reports results includes links to plot each storm. The grid tab provides a sortable table of storms.
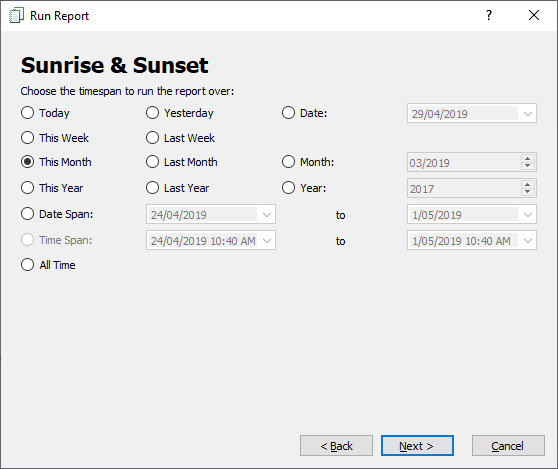
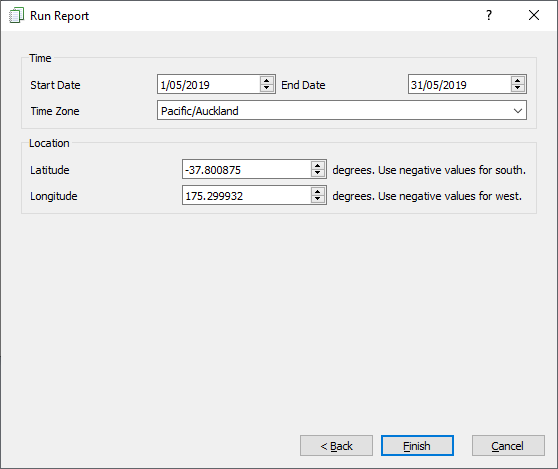
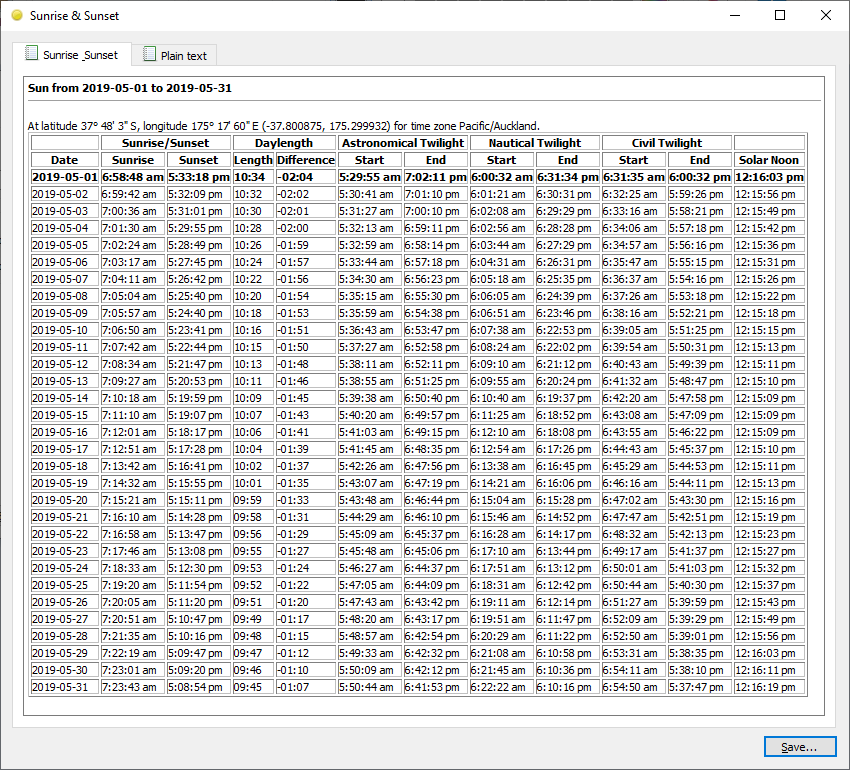
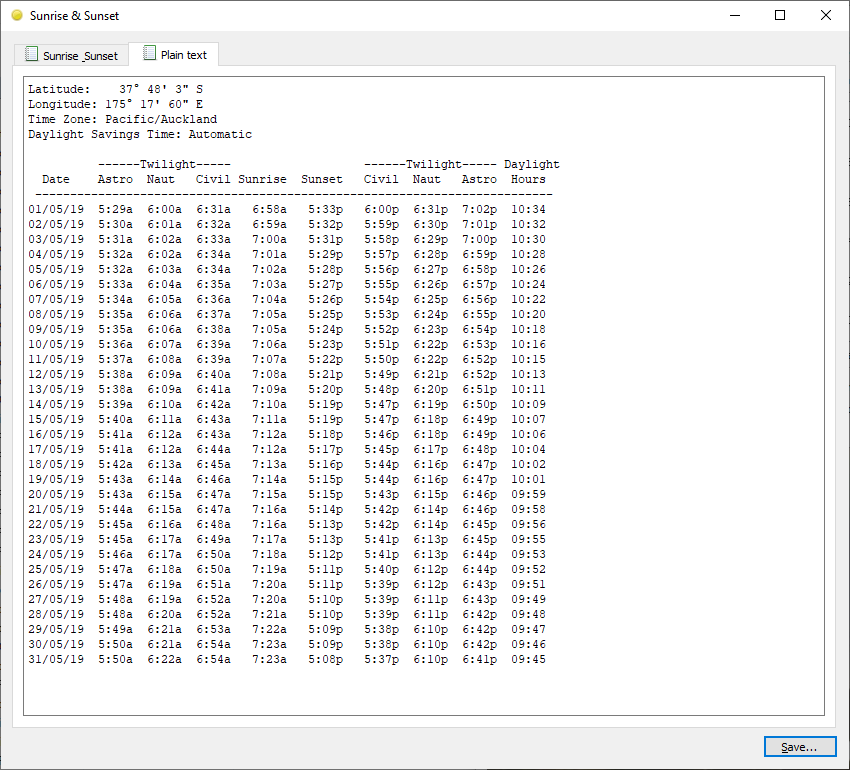
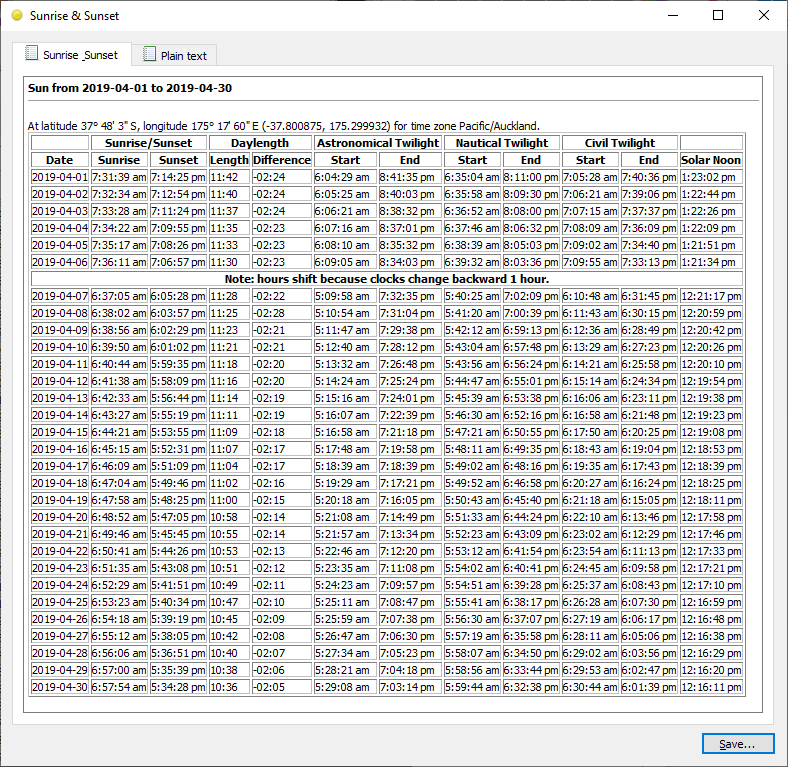
Sunrise & Sunset
This report produces output in both HTML and plain-text. The HTML view highlights the current date in bold and includes a note when hours shift due to daylight savings.
Past changes
- 12 December 2018
- Fixed Bugs
- Fix context menu and pop-out being available on image widges showing no image
- Fix time shown in image properties dialog (it was showing the month instead of minute)
- Possibly fix image polling when using the Web Interface for live data
- Fix video player media status at end of video
- Fix drag from image thumbnail list in image browser
- Fix a number of build warnings which which will probably solve some issues
- Fix database error when switching sample source from web to database while leaving live source as web or tcp
- Fix image properties window size
- Fix context menu on weather values on main window
- Fix bug where removing the leading point in a live plot would crash the app
- Fix hour and day aggregate groupings. These now begin at the start of the hour or day rathern than just being 1 or 24 hour buckets starting from the start of the timespan
- Fix a number of memory initialisation bugs
- Fixed minor linux build issues
- Maybe fix weird bug where only rain rate shows in the main window rainfall widget
- Fix video playback controls being enabled before video is ready
- Fix bug switching from a video to a folder displays video controls over the top of the folder icon
- New Features
- Cache size and buttons to clear the cache in the settings window
- Ability to show/hide the key (X) axis for a dataset - useful if you have multiple datasets aligned by time-of-day (eg, showing yesterday vs today) where the two axes show the same times.
- Ability to show/hide an entire dataset
- Added DataSets window which lists datasets in a chart (showing its timespan and aggregate) and provides checkboxes to show/hide the dataset or just its key axis
- Reporting system with support for both built-in and user-defined reports. Built in reports are:
- Monthly Averages - Average high/low, daily mean, average rainfall, etc, across the entire station dataset for each month
- NOAA Month Summary - summary data for an entire month
- NOAA Year Summary - summary data for an entire year
- Rainfall - shows rainfall for each year in the stations entire dataset
- Station Records - Gives station records (highs and lows over the entire data set for the station)
- Storm Rain - Calculates storm rain episodes over any timespan. Provides links to plot a chart of each storm.
- Sunrise & Sunset - gives sun rise and set times for a chosen location.
- Added a cursor to the chart window allowing you to show values under the cursor
- Chart Window - right clicking on an item in the charts legend will select the legend item, its associated graph, and show options for that graph as well as the legend itself.
- Images window overhaul
- Added different views (Small thumbnails, icons, list, detail)
- Now updates automatically when new images are available
- Added option to turn preview and tree on or off
- Added a toolbar. Buttons: Navigate up, toggle tree, toggle preview, view mode (thumbnails, small thumbnails, icons, list, detail), open, show weather, save as, properties.
- Added a status bar showing current folder and item count
- Image preview now updates from icon to the selected image when the image has finished downloading
- Now selects and shows images for the current day (where any exist) on open.
- Other Enhancements
- Move temporary files to a temp directory in the cache directory. This should make manual cleanup easier if any files get left lying around due to crashes, etc
- Include all licenses in the about dialog
- Reworked cache database to be more similar to the postgresql schema
- Added more station info to the cache database. Hardware type and solar sensor availability is now cached.
- Increase minimum size of weather data panel in weather for image window to stop it from jumping around during video playback
- Improve handling of null data (now shows as a gap in a chart, a -- in the view data window or either empty or dash in export (option).
- Nulls are now sorted as being greater than all null values in the view data window. Sorting by smallest first will put null values at the bottom.
- Fix add-dataset behaviour. Now it just adds the dataset with minimal fuss instead of rebuilding the enitre chart (throwing away your customisations in the process)
- Don't show transmitter battery status on main window for cabled davis weather stations
- Don't show wireless reception option in chart and export dialogs for davis weather stations
- Cache database is now optimised after loading archive data to improve query performance
- Minimum database schema is now V3 (zxweather v1.0.0)
- Data files for past months will now only be downloaded once every 24 hours. This should speed up long timespan data requests a bit
- Console battery voltage now shows a low battery icon when voltage is 3.5V or below
- View data window now appears in the taskbar
- Support for building without ECPG (this disables support for receiving live data from the database)
- Support for building without audio and video playback support
- Add a refresh option to the rainfall widgets context menu
- Significantly improved performance (by about 100x) of sorting by timestamp in the view data window for large data sets
- Lower idle CPU usage when warn if live data is late is enabled.
- Significantly improve cache validation performance. Running charts/view data/export/reports over large timespans that already exist in the cache should be much faster now.
- Chart title is now shown in the chart window titlebar
- Setting a chart title to nothing now removes the title entirely
- Add graph option is only enabled when there are graphs available for adding
- Weather station name now comes first in the main window titlebar
- Chart window now has proper toolbars
- Chart window now remembers its size and position
- Chart axes are no longer locked by default - they will move individually unless you lock them from the context menu
- Added option to rescale/realign chart to the context menu even when only one dataset is present. When multiple datasets are present this will reapply the last used alignment option.
- Better formatting of sizes in image properties window, handle total_size metadata attribute, show encoding time as hh:mm:ss when value is over 60 seconds.
- Fixed Bugs
- 22 April 2018
- Bugs
- Fix settings window tab order
- Fix image and sizing on main window. Image is now always the appropriate size, blank space no longer appears above the tabs on vertical resize. Window can now no longer be shrunk vertically below the size of the image.
- Fix image panel on main window disappearing when switching between stations with image sources
- Fix 'Sum' and 'Running Total' aggregates applying to columns that don't make sense (eg, temperature). These aggregates now only apply to rainfall and evapotranspiration with all other columns being averaged instead when they're a part of the data set.
- Fixed data queries not returning any data for FineOffset type stations in the database data source
- Fixed crash in view data window when viewing data from a FineOffset type weather station
- Fixed image browser when using the database data source
- Fix failure to cache latest image on app start
- Features
- Live Charts - show changes in weather updates over any timespan from 2.5 seconds up to 5 minutes
- Images on the main window (and elsewhere) now have a context menu offering open in new window, save as, view weather data at time and properties.
- Enhancements
- Columns can now be rearranged in the view data window
- For Davis weather stations; day, month and year rainfall will be updated every 2.5 seconds based on observed changes in storm rain. Where storm rain disagrees with recorded rainfall this rainfall guess will be cleared when the next 5 minute rainfall total comes in.
- Better handling of audio files (such as the satellite broadcast on the 14/2/2017 for rua2):
- File and window icons
- Playback
- Proper identification in strings (save as "Audio files (*.wav)" instead of "Image files (*.wav)", etc)
- Correct file extension on cache file
- Bugs
- 23 March 2018
- Bugs
- Fix rain rate chart triggered from rainfall widget not plotting correctly
- Fix custom X axis timespan not appearing correctly in the change timespan window (custom radio button selected but date/time inputs disabled)
- Fix day/month/year range plots triggered from rainfall widget or current conditions context menu not selecting the correct radio button in change X axis timespan window
- Features
- Add copy option to chart context menu
- Double clicking an image in the image browser now pops it out into a new window
- Other
- Upgraded charting library from v1.3 to 2.0. This may introduce a few regressions.
- Bugs
- 22 March 2018
- Bugs
- Fixed day rainfall chart not updating after midnight.
- Fix random progress dialog appearing at times around 2 seconds after application startup
- Features
- You can now double click on the bars in the rainfall visualisation to plot a chart
- You can now right-click on the rainfall visualisation and weather values on the main window for a context menu with additional options
- Bugs