Weather for 2024-09-06
Records
| Sensor | Min | Max |
|---|---|---|
| Temperature | 12.2°C at 06:50:00 | 16.7°C at 12:50:00 |
| Apparent Temperature | 11.3°C at 06:45:00 | 16.3°C at 12:50:00 |
| Wind Chill | 12.2°C at 06:50:00 | 16.7°C at 12:50:00 |
| Dew Point | 9.5°C at 16:40:00 | 11.9°C at 12:15:00 |
| Humidity | 68% at 13:30:00 | 87% at 07:10:00 |
| Barometer | 1018.2 hPa at 15:40:00 | 1021.7 hPa at 08:50:00 |
| Gust Wind Speed | 10.7 m/s at 18:30:00 | |
| Average Wind Speed | 3.1 m/s at 18:30:00 |
Total Rainfall: 0.0mm
1-day Charts
7-day Charts
Data is a 30-minute average.
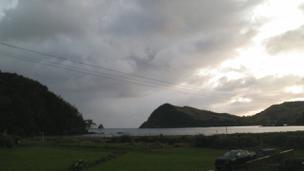
TestCam
TestCam is a prototype to see what having pictures here is like. New photo every hour from sunrise to sunset plus a time-lapse video at the end of the day (usually 15-30 minutes after civil dusk).


