Likely permanently offline: What was originaly intended to be a temporary outage for repairs will likely be permanent due to a much better weather station being setup in near by Hamilton East. Reinstating the Ruakura station is probably not worth the fairly high repair cost now.
Weather for 2018-05-18
Records
| Sensor | Min | Max |
|---|---|---|
| Temperature | 7.4°C at 08:10:00 | 18.1°C at 12:55:00 |
| Apparent Temperature | 6.6°C at 08:10:00 | 19.2°C at 12:55:00 |
| Wind Chill | 7.4°C at 08:10:00 | 18.1°C at 12:55:00 |
| Dew Point | 6.3°C at 05:55:00 | 14.1°C at 11:50:00 |
| Humidity | 70% at 15:00:00 | 94% at 10:10:00 |
| Barometer | 1012.9 hPa at 00:00:00 | 1016.5 hPa at 10:15:00 |
| Gust Wind Speed | 1.3 m/s at 16:25:00 | |
| Average Wind Speed | 0.4 m/s at 16:25:00 |
Total Rainfall: 0.2mm
1-day Charts
7-day Charts
Data is a 30-minute average.
Ruakura Ground Station
These images are received directly from polar orbiting weather statellites (NOAA-15, NOAA-18 and NOAA-19) each of which travels across the sky at least twice a day. Received broadcasts are analog APT signals so the images tend to have noise at the top and bottom where the satellite is closer to the horizon.
The satellites orbits vary from day to day so the country tends to move around in the images a bit. The rotation of the image tends to vary based on which direction the satellite is traveling in. How tall the image is depends on how long the satellite is within range of the ground station. The tall lower noise images are from high elevation passes (where the satellite travels nearly overhead) where as the short noisy images are from low elevation passes where the satellite is traveling along the horizon just within range of the ground station (often not far enough in range to produce an image).
Each satellite pass produces several images with various enhancements applied. See: A description of satellite enhancements for more details.
-
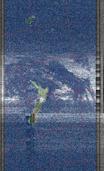 MCIR false colour enhancement, NOAA 19 Southbound @ 58° elevation, 03:26:12
 -
 ZA false colour enhancement, NOAA 19 Southbound @ 58° elevation, 03:26:12
 -
 sea false colour enhancement, NOAA 19 Southbound @ 58° elevation, 03:26:12
 -
 therm false colour enhancement, NOAA 19 Southbound @ 58° elevation, 03:26:12
 -
 NO false colour enhancement, NOAA 19 Southbound @ 58° elevation, 03:26:12
 -
 unenhanced, NOAA 19 Southbound @ 58° elevation, 03:26:12
 -
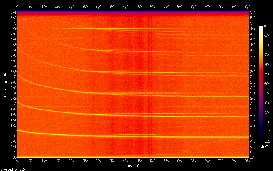 Spectrogram for NOAA 19 pass at 03:26:12
 -
 MCIR false colour enhancement, NOAA 15 Southbound @ 28° elevation, 06:34:44
 -
 ZA false colour enhancement, NOAA 15 Southbound @ 28° elevation, 06:34:44
 -
 sea false colour enhancement, NOAA 15 Southbound @ 28° elevation, 06:34:44
 -
 therm false colour enhancement, NOAA 15 Southbound @ 28° elevation, 06:34:44
 -
 NO false colour enhancement, NOAA 15 Southbound @ 28° elevation, 06:34:44
 -
 unenhanced, NOAA 15 Southbound @ 28° elevation, 06:34:44
 -
 Spectrogram for NOAA 15 pass at 06:34:44
 -
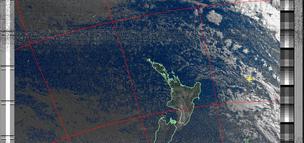 MSA false colour enhancement, NOAA 18 Southbound @ 30° elevation, 07:46:39
 -
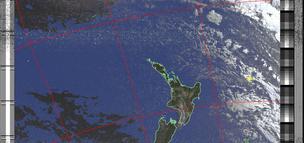 HVCT false colour enhancement, NOAA 18 Southbound @ 30° elevation, 07:46:39
 -
 MCIR false colour enhancement, NOAA 18 Southbound @ 30° elevation, 07:46:39
 -
 ZA false colour enhancement, NOAA 18 Southbound @ 30° elevation, 07:46:39
 -
 sea false colour enhancement, NOAA 18 Southbound @ 30° elevation, 07:46:39
 -
 therm false colour enhancement, NOAA 18 Southbound @ 30° elevation, 07:46:39
 -
 NO false colour enhancement, NOAA 18 Southbound @ 30° elevation, 07:46:39
 -
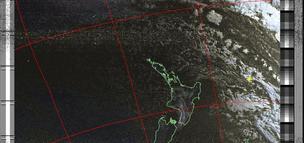 HVC false colour enhancement, NOAA 18 Southbound @ 30° elevation, 07:46:39
 -
 unenhanced, NOAA 18 Southbound @ 30° elevation, 07:46:39
 -
 Spectrogram for NOAA 18 pass at 07:46:39
 -
 MSA false colour enhancement, NOAA 19 Northbound @ 71° elevation, 15:50:06
 -
 HVCT false colour enhancement, NOAA 19 Northbound @ 71° elevation, 15:50:06
 -
 MCIR false colour enhancement, NOAA 19 Northbound @ 71° elevation, 15:50:06
 -
 ZA false colour enhancement, NOAA 19 Northbound @ 71° elevation, 15:50:06
 -
 sea false colour enhancement, NOAA 19 Northbound @ 71° elevation, 15:50:06
 -
 therm false colour enhancement, NOAA 19 Northbound @ 71° elevation, 15:50:06
 -
 NO false colour enhancement, NOAA 19 Northbound @ 71° elevation, 15:50:06
 -
 HVC false colour enhancement, NOAA 19 Northbound @ 71° elevation, 15:50:06
 -
 unenhanced, NOAA 19 Northbound @ 71° elevation, 15:50:06
 -
 Spectrogram for NOAA 19 pass at 15:50:06
 -
 MCIR false colour enhancement, NOAA 18 Northbound @ 62° elevation, 20:09:50
 -
 ZA false colour enhancement, NOAA 18 Northbound @ 62° elevation, 20:09:50
 -
 sea false colour enhancement, NOAA 18 Northbound @ 62° elevation, 20:09:50
 -
 therm false colour enhancement, NOAA 18 Northbound @ 62° elevation, 20:09:50
 -
 NO false colour enhancement, NOAA 18 Northbound @ 62° elevation, 20:09:50
 -
 unenhanced, NOAA 18 Northbound @ 62° elevation, 20:09:50
 -
 Spectrogram for NOAA 18 pass at 20:09:50