Current Conditions
| Sensor | Value |
|---|---|
| Temperature | 17.7°C |
| Apparent Temperature | 18.3°C |
| Wind Chill | 17.7°C |
| Dew Point | 12.1°C |
| Humidity | 70.0% |
| Barometer | 1006.8 hPa |
| Wind Speed | -- |
| Wind Direction | -- |
| UV Index | -- |
| Solar Radiation | 5.0 W/m² |
| Rain Rate | -- |
| Current Storm Rain | 4.2 mm |
Todays Records
| Sensor | Min | Max |
|---|---|---|
| Temperature | 14.4°C at 05:35:00 | 21.5°C at 18:05:00 |
| Apparent Temperature | 14.8°C at 12:00:00 | 21.9°C at 18:00:00 |
| Wind Chill | 14.4°C at 05:35:00 | 21.5°C at 18:05:00 |
| Dew Point | 11.0°C at 14:05:00 | 14.6°C at 07:50:00 |
| Humidity | 55% at 18:10:00 | 90% at 06:45:00 |
| Barometer | 989.6 hPa at 00:00:00 | 1005.7 hPa at 23:55:00 |
| Gust Wind Speed | 11.6 m/s at 10:45:00 | |
| Average Wind Speed | 3.1 m/s at 17:45:00 |
Forecast
Last 24 Hours
Total Rainfall: 1.2mm
Last 7 Days
Data is a 30-minute average over the past seven days.
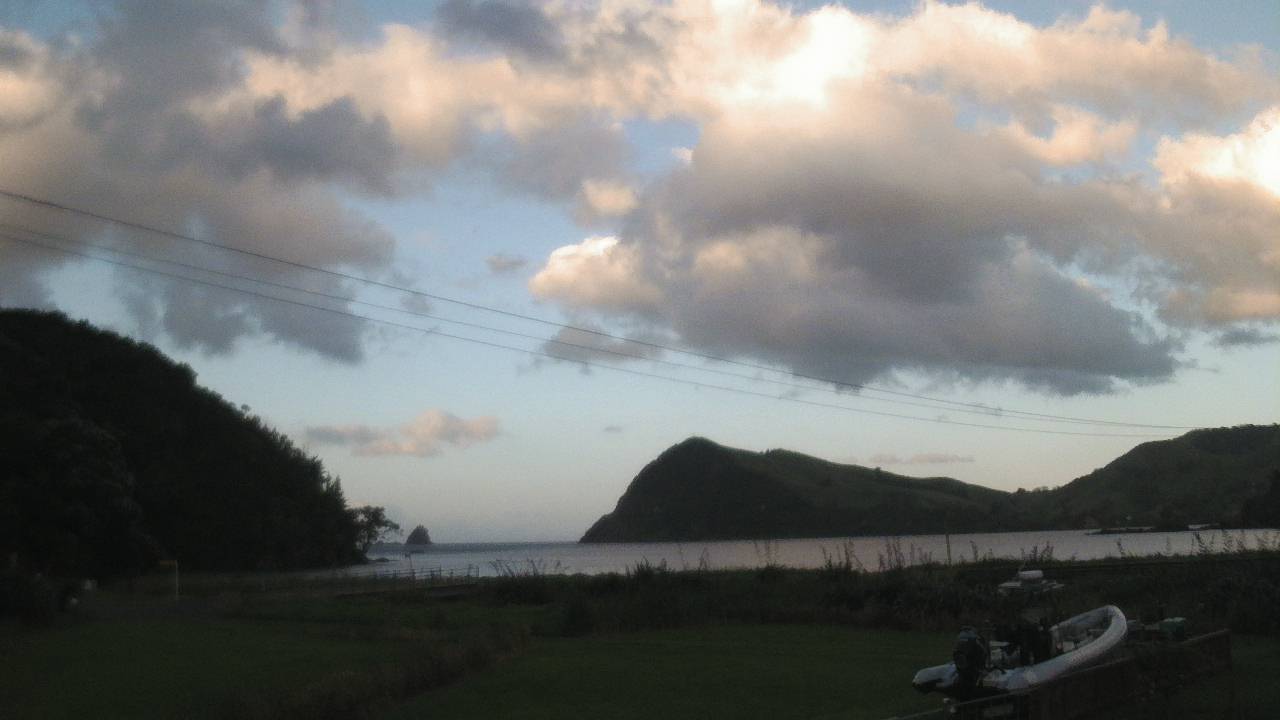
TestCam
TestCam is a prototype to see what having pictures here is like. New photo every hour from sunrise to sunset plus a time-lapse video at the end of the day (usually 15-30 minutes after civil dusk).

Weather History
Full weather data is available at the day, month and year levels. You can start browsing by year: 2025, 2024, 2023, 2022, 2021, 2020, 2019, 2018, 2017, 2016, 2015


